Break-Even Analysis: The Complete Guide for 2026
Master break-even analysis for your business. Learn formulas, see real examples across industries, and use our free calculator to find your break-even point in minutes.
Break-Even Analysis: The Complete Guide for 2026
Break-even analysis is one of the most critical financial tools every business owner should master. It tells you exactly when your business stops losing money and starts making profit—and gives you a clear target to aim for.
Whether you're launching a new product, evaluating pricing strategies, or planning your next fiscal year, understanding your break-even point is non-negotiable. This guide will teach you everything you need to know.
Calculate Your Break-Even Point Now →
What is Break-Even Analysis?
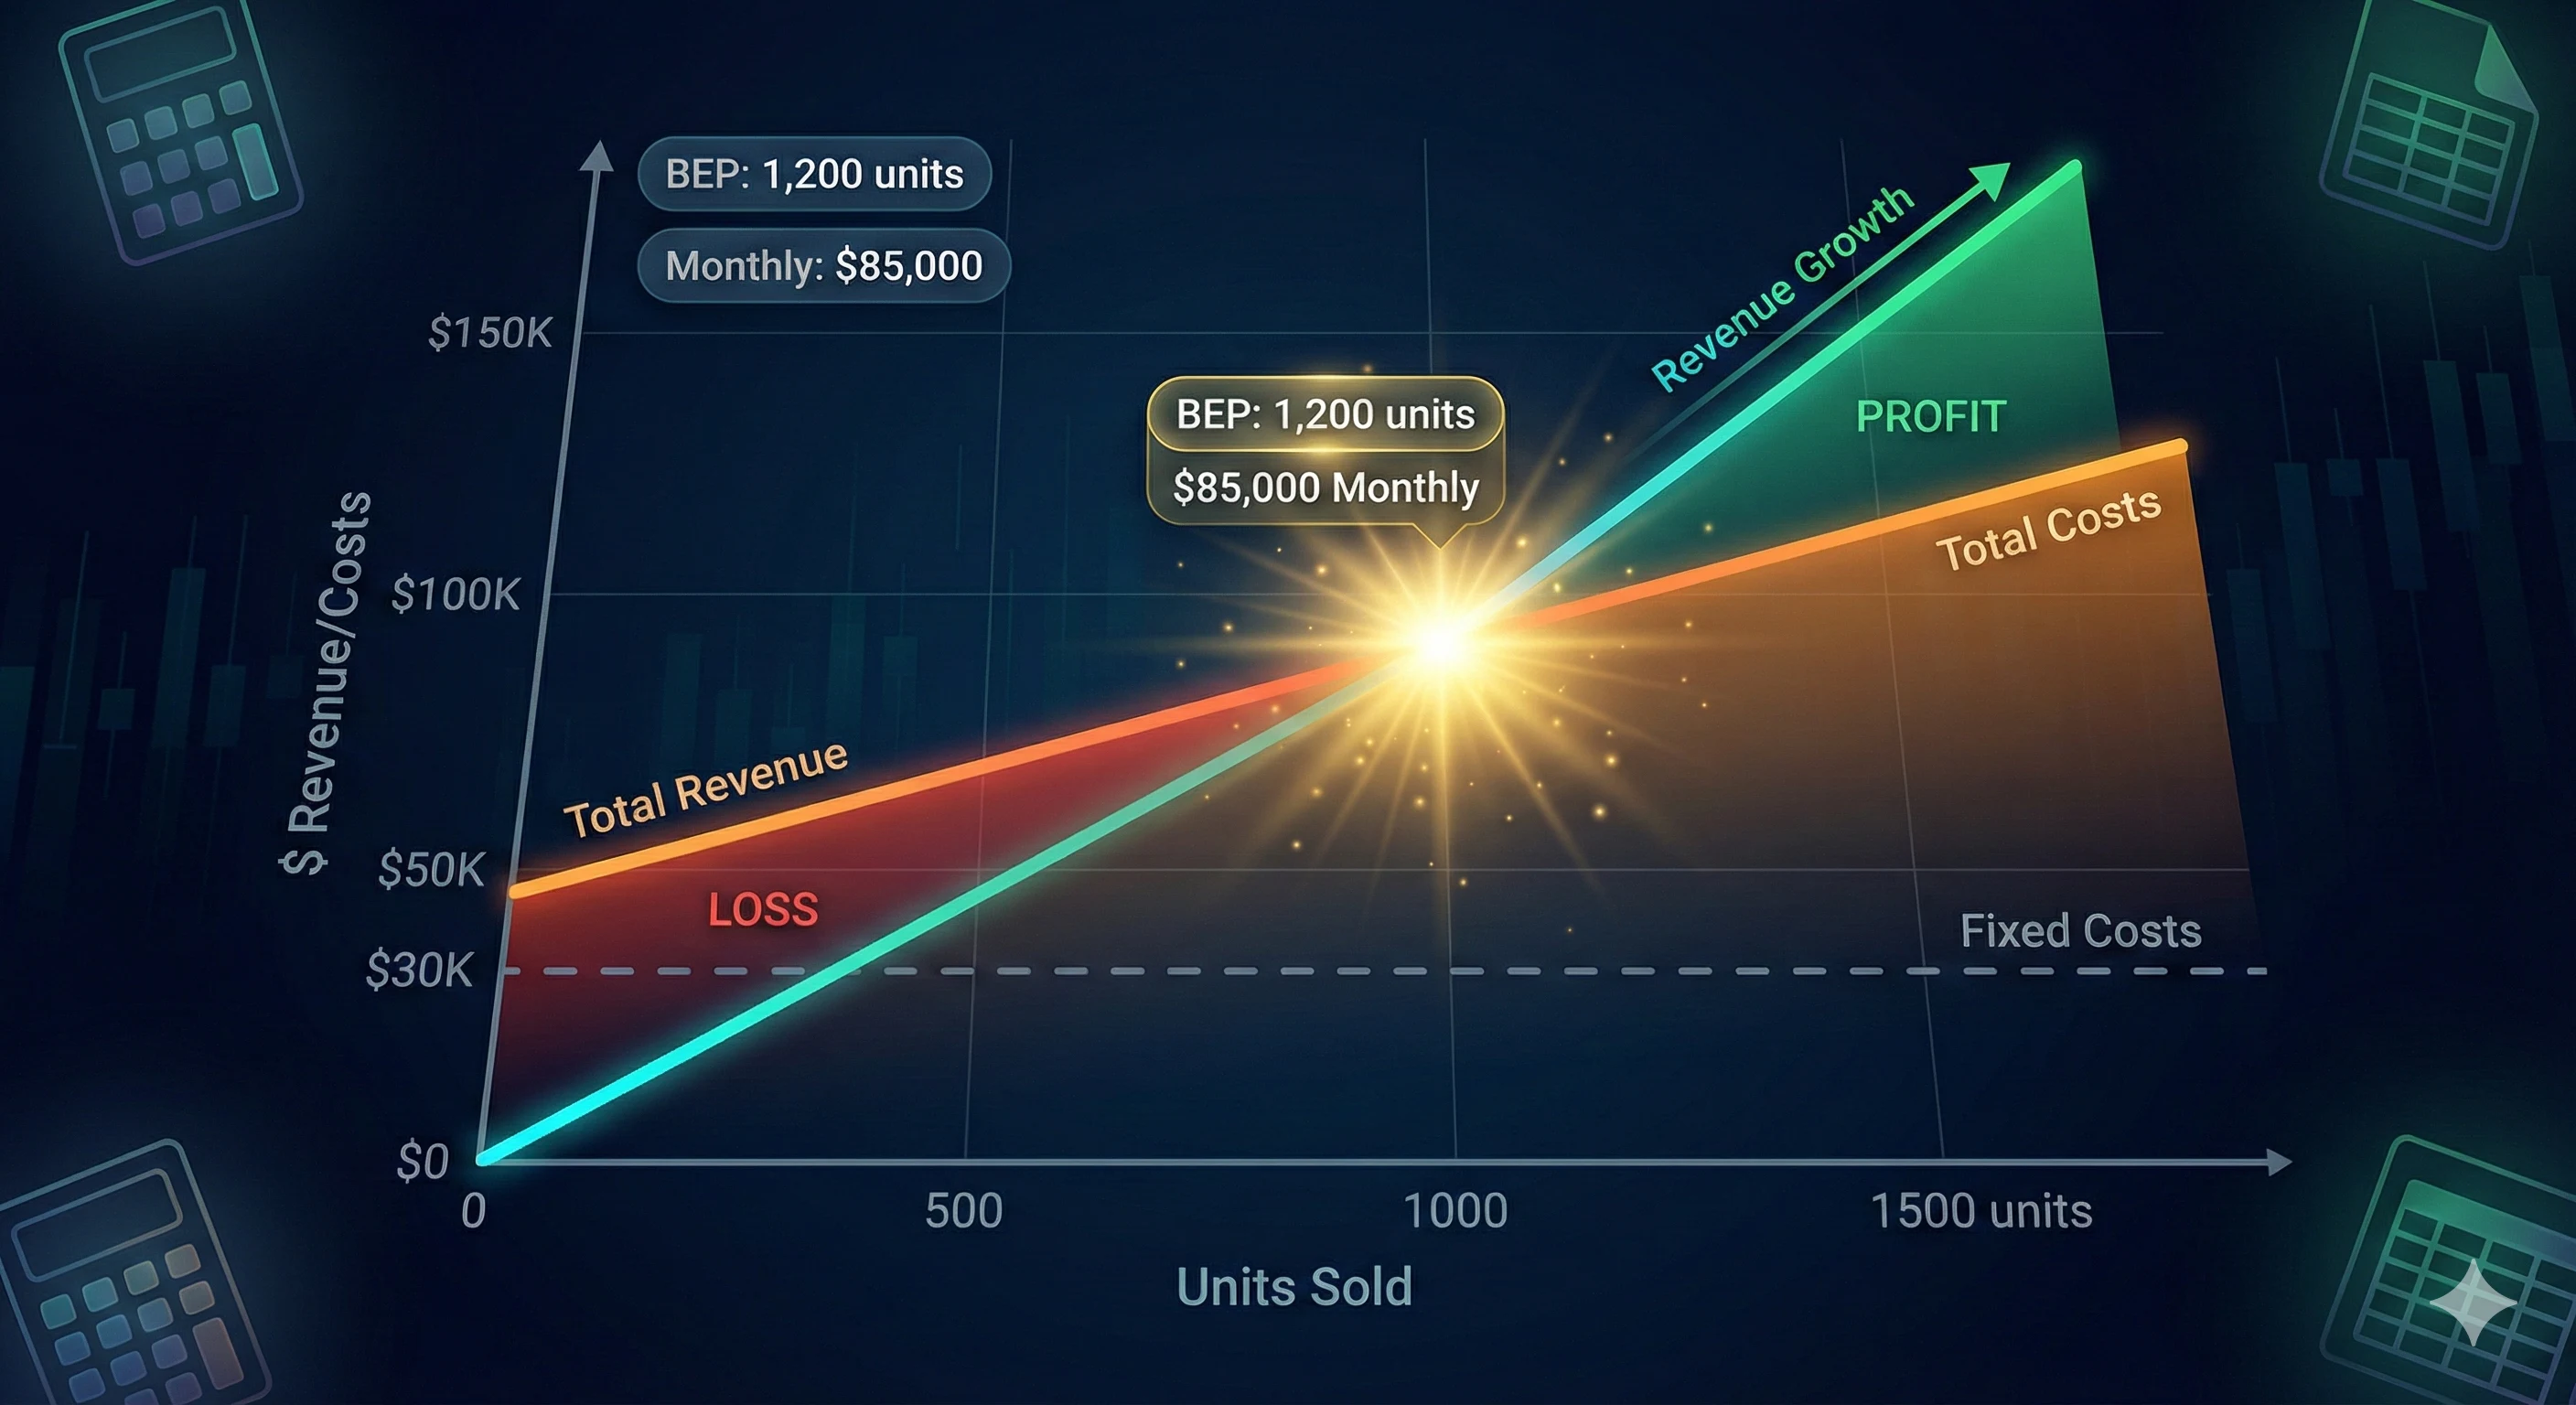
Break-even analysis identifies the point where total revenue equals total costs—meaning you're neither making a profit nor a loss. It answers the fundamental question: "How many units do I need to sell to cover all my costs?"
Why Break-Even Analysis Matters
For Startups:
- Validates business viability before launching
- Helps set realistic sales targets
- Informs pricing strategy
- Critical for investor pitches
For Established Businesses:
- Evaluates new product launches
- Assesses pricing changes
- Guides expansion decisions
- Identifies cost-cutting opportunities
For Everyone:
- Provides clear financial targets
- Reduces risk in decision-making
- Helps negotiate with suppliers
- Builds financial confidence
Fixed Costs vs. Variable Costs
Understanding the difference between fixed and variable costs is crucial for break-even analysis.
Fixed Costs
Costs that stay the same regardless of sales volume.
Common Fixed Costs:
- Rent and utilities
- Salaries (non-commission)
- Insurance premiums
- Software subscriptions
- Equipment leases
- Marketing retainers
- Website hosting
- Legal and accounting fees
Example: Whether you sell 0 units or 1,000 units, your office rent stays at $3,000/month.
Variable Costs
Costs that increase directly with each unit sold.
Common Variable Costs:
- Product manufacturing costs (COGS)
- Raw materials
- Packaging and shipping
- Payment processing fees (2-3% of sale)
- Sales commissions
- Per-transaction fulfillment costs
- Direct labor (hourly workers)
Example: If each product costs $15 to manufacture and ship, selling 100 units costs $1,500, while 1,000 units costs $15,000.
Semi-Variable Costs
Some costs have both fixed and variable components.
Examples:
- Utilities: Base charge (fixed) + usage charge (variable)
- Salaries: Base salary (fixed) + commission (variable)
- Shipping: Flat packaging cost (fixed) + weight-based shipping (variable)
How to Handle: Break them into fixed and variable components for accurate analysis.
The Break-Even Formulas
Break-Even Point in Units
Break-Even Units = Fixed Costs / (Price - Variable Cost per Unit)
Or expressed differently:
Break-Even Units = Fixed Costs / Contribution Margin per Unit
Break-Even Point in Revenue
Break-Even Revenue = Fixed Costs / Contribution Margin Ratio
Where:
Contribution Margin Ratio = (Price - Variable Cost) / Price
Key Terms Explained
Contribution Margin per Unit: How much each sale contributes to covering fixed costs and generating profit.
Contribution Margin Ratio: Contribution margin expressed as a percentage of price.
Step-by-Step Calculation Guide
Step 1: List All Fixed Costs
Add up everything you pay regardless of sales:
Example (E-commerce Brand):
- Office rent: $2,500
- Salaries: $8,000
- Software subscriptions: $500
- Insurance: $300
- Marketing (fixed): $1,500
- Total Fixed Costs: $12,800/month
Step 2: Calculate Variable Cost per Unit
Add up all costs that vary with each sale:
Example (Product):
- Manufacturing: $12.00
- Packaging: $2.00
- Shipping: $4.50
- Payment processing (3% of $50): $1.50
- Total Variable Cost: $20.00/unit
Step 3: Determine Selling Price
Example: $50.00 per unit
Step 4: Calculate Contribution Margin
Contribution Margin = $50.00 - $20.00 = $30.00 per unit
Contribution Margin Ratio = $30.00 / $50.00 = 60%
Step 5: Calculate Break-Even Point
Units:
Break-Even = $12,800 / $30.00 = 427 units/month
Revenue:
Break-Even Revenue = 427 × $50 = $21,350/month
Or: $12,800 / 0.60 = $21,333/month
What This Means: You need to sell 427 units ($21,350 in revenue) every month to cover all costs. Every unit beyond 427 is pure profit.
Or use our calculator: Break-Even Calculator →
Real-World Examples Across Industries
Example 1: E-commerce Store (Apparel)
Business Profile:
- Online clothing brand
- Average product price: $65
- Direct-to-consumer model
Costs:
- Fixed costs: $18,500/month
- Platform fees: $300
- Staff: $12,000
- Marketing (fixed): $4,000
- Software: $800
- Utilities/office: $1,400
- Variable costs per unit: $24
- Manufacturing: $18
- Packaging: $2
- Shipping: $3
- Processing fees (3%): $1
Calculation:
Contribution Margin = $65 - $24 = $41
Break-Even Units = $18,500 / $41 = 451 units/month
Break-Even Revenue = 451 × $65 = $29,315/month
Insight: Needs 15 orders per day to break even. Currently averaging 22 orders/day, so generating healthy profit.
Example 2: SaaS Company
Business Profile:
- Project management software
- Subscription: $49/month
- Cloud-based service
Costs:
- Fixed costs: $45,000/month
- Engineering team: $28,000
- Sales team: $10,000
- Infrastructure (base): $3,000
- Marketing: $3,000
- Office/admin: $1,000
- Variable costs per customer: $3/month
- Cloud hosting per user: $2
- Support: $0.50
- Payment processing (3%): $0.50
Calculation:
Contribution Margin = $49 - $3 = $46
Break-Even Customers = $45,000 / $46 = 978 customers
Break-Even MRR = 978 × $49 = $47,922
Insight: Needs 978 paying subscribers. Currently at 1,250 subscribers, generating $12,500/month profit.
Example 3: Restaurant
Business Profile:
- Casual dining restaurant
- Average check: $35 per person
- 50 seats
Costs:
- Fixed costs: $32,000/month
- Rent: $8,000
- Salaried staff: $15,000
- Utilities: $2,500
- Insurance: $1,500
- Marketing: $2,000
- Equipment leases: $3,000
- Variable costs per customer: $14
- Food cost: $10
- Hourly staff (allocated): $3
- Disposables: $1
Calculation:
Contribution Margin = $35 - $14 = $21
Break-Even Customers = $32,000 / $21 = 1,524 customers/month
Break-Even Revenue = 1,524 × $35 = $53,340/month
Insight: Needs 1,524 customers per month = 51 customers/day. With 50 seats and 2 turns per day, that's roughly 100 seats/day capacity. Running at 51% capacity to break even.
Example 4: Service Business (Marketing Agency)
Business Profile:
- Digital marketing agency
- Average project: $5,000
- Retainer model
Costs:
- Fixed costs: $28,000/month
- Staff salaries: $22,000
- Office: $2,500
- Software tools: $2,000
- Insurance: $500
- Marketing: $1,000
- Variable costs per project: $1,200
- Freelance help: $800
- Ad spend management: $300
- Software per project: $100
Calculation:
Contribution Margin = $5,000 - $1,200 = $3,800
Break-Even Projects = $28,000 / $3,800 = 7.4 projects
Break-Even Revenue = 7.4 × $5,000 = $37,000/month
Insight: Needs 8 projects per month (2 per week). Currently at 12 projects/month, generating solid profit.
Example 5: Fitness Studio
Business Profile:
- Boutique yoga studio
- Average monthly membership: $120
- Class-based model
Costs:
- Fixed costs: $14,500/month
- Rent: $5,000
- Lead instructor: $4,000
- Utilities: $800
- Insurance: $700
- Marketing: $2,000
- Equipment/maintenance: $2,000
- Variable costs per member: $8
- Additional instructor pay: $5
- Cleaning supplies: $2
- Towel service: $1
Calculation:
Contribution Margin = $120 - $8 = $112
Break-Even Members = $14,500 / $112 = 129 members
Break-Even Revenue = 129 × $120 = $15,480/month
Insight: Needs 129 members. Currently at 185 members, generating $10,360/month profit.
Industry Benchmarks
Based on analysis of thousands of businesses:
E-commerce/Retail
| Metric | Typical Range | Goal |
|---|---|---|
| Contribution Margin Ratio | 40-65% | 50%+ |
| Break-even time (new store) | 12-24 months | < 18 months |
| Monthly revenue needed | 2-3x fixed costs | 3x+ |
SaaS
| Metric | Typical Range | Goal |
|---|---|---|
| Contribution Margin Ratio | 85-95% | 90%+ |
| Break-even time (new company) | 18-36 months | < 24 months |
| MRR needed | 1.2-1.5x fixed costs | 1.3x+ |
Restaurants
| Metric | Typical Range | Goal |
|---|---|---|
| Food cost percentage | 28-35% | < 32% |
| Break-even capacity | 40-60% | < 50% |
| Contribution margin ratio | 40-50% | 45%+ |
Service Businesses
| Metric | Typical Range | Goal |
|---|---|---|
| Contribution Margin Ratio | 65-80% | 70%+ |
| Break-even utilization | 40-60% | < 50% |
| Projects needed monthly | 50-70% capacity | 60%+ |
How to Reduce Your Break-Even Point
Lowering your break-even point gives you more safety margin and faster path to profit. Here are proven strategies:
Strategy 1: Reduce Fixed Costs
Immediate Actions:
- Renegotiate rent or move to cheaper location
- Switch from full-time to contract workers where possible
- Cancel unused subscriptions and software
- Negotiate better rates with suppliers
- Share office space or go remote
Example Impact: Reducing fixed costs from $15,000 to $12,000 drops break-even from 500 units to 400 units (20% reduction).
Strategy 2: Decrease Variable Costs
Tactics:
- Negotiate volume discounts with suppliers
- Find cheaper shipping options
- Optimize packaging to reduce costs
- Reduce processing fees (switch providers)
- Improve production efficiency
Example Impact: Reducing variable cost per unit from $20 to $18 (with $30 contribution margin) drops break-even from 500 to 417 units (17% reduction).
Strategy 3: Increase Prices
Approach Carefully:
- Test price increases on new customers first
- Bundle products to justify higher prices
- Add value before raising prices
- Grandfather existing customers
- Monitor conversion rate impact
Example Impact: Raising price from $50 to $55 (maintaining $20 variable cost) drops break-even from 500 to 436 units (13% reduction).
Warning: Price increases affect demand. Model the impact:
- 10% price increase with 5% volume decrease = net positive
- 10% price increase with 15% volume decrease = net negative
Strategy 4: Improve Product Mix
Focus on High-Margin Products:
- Analyze contribution margin by product
- Promote high-margin products more
- Discontinue or de-emphasize low-margin items
- Upsell to higher-margin tiers
- Create bundles with mixed margins
Example:
- Product A: $30 margin (30 units sold)
- Product B: $45 margin (20 units sold)
- Shifting 5 sales from A to B increases total contribution by $75
Strategy 5: Optimize Marketing Spend
Balance Fixed vs. Variable Marketing:
- Shift from fixed retainers to performance-based
- Use affiliate marketing (variable cost model)
- Focus on organic channels (content, SEO)
- Improve conversion rate (more value from same spend)
Strategy 6: Increase Operational Efficiency
Scale Without Adding Fixed Costs:
- Automate repetitive tasks
- Improve processes to handle more volume
- Cross-train staff for flexibility
- Use fractional services (CFO, HR, etc.)
Contribution Margin vs. Gross Margin
These terms are often confused. Here's the difference:
Contribution Margin
Contribution Margin = Revenue - Variable Costs
What it includes: Only costs that vary directly with each sale
What it excludes: All fixed costs
Purpose: Break-even analysis, pricing decisions, product profitability
Gross Margin
Gross Margin = Revenue - Cost of Goods Sold (COGS)
What it includes: Direct costs to produce/acquire product
What it excludes: Operating expenses, marketing, overhead
Purpose: Financial reporting, pricing, inventory valuation
Key Difference
COGS typically includes some fixed costs (factory overhead, salaried production managers), while variable costs are strictly per-unit costs.
Example:
- Revenue: $100
- Variable costs: $35
- COGS: $40 (includes $5 of allocated fixed factory overhead)
- Contribution Margin: $65
- Gross Margin: $60
For break-even analysis, use contribution margin. For financial statements, use gross margin.
Margin of Safety
Once you know your break-even point, calculate your margin of safety—how far above break-even you're operating.
Formula
Margin of Safety = (Actual Sales - Break-Even Sales) / Actual Sales × 100%
Example
- Break-even: 400 units/month
- Actual sales: 600 units/month
- Margin of Safety: (600 - 400) / 600 = 33.3%
What This Means: Sales could drop by 33.3% before you start losing money. The higher the margin of safety, the less risky your business.
Interpreting Margin of Safety
| Margin of Safety | Risk Level | Action Needed |
|---|---|---|
| < 10% | Critical | Immediate cost reduction or revenue increase |
| 10-20% | High | Focus on improvement |
| 20-35% | Moderate | Healthy but room for optimization |
| 35-50% | Low | Good position, consider growth |
| > 50% | Very Low | Excellent cushion, scale aggressively |
Common Break-Even Analysis Mistakes
Mistake #1: Forgetting Semi-Variable Costs
Problem: Treating all utilities as fixed, when usage varies with production.
Fix: Split semi-variable costs into fixed and variable components.
Mistake #2: Using Revenue Instead of Contribution Margin
Problem: Dividing fixed costs by revenue instead of contribution margin.
Fix: Always use contribution margin in the denominator.
Mistake #3: Ignoring Time Periods
Problem: Mixing monthly fixed costs with annual variable costs.
Fix: Ensure all numbers use the same time period (monthly or annually).
Mistake #4: Assuming Linear Relationships
Problem: Assuming costs scale perfectly linearly at all volumes.
Reality:
- Volume discounts reduce variable costs at scale
- Capacity constraints add fixed costs at thresholds
- Some costs are stepped (hire person 5, then 10, then 15)
Fix: Recalculate break-even at different scale levels.
Mistake #5: Ignoring Product Mix
Problem: Treating all products as having the same margin.
Fix: Calculate weighted average contribution margin across product mix, or analyze each product separately.
Mistake #6: Not Updating Regularly
Problem: Using outdated cost data as costs change.
Fix: Recalculate break-even quarterly or when costs change significantly.
Mistake #7: Forgetting Payment Processing Fees
Problem: Not including 2-3% credit card fees in variable costs.
Fix: Always include payment processing as a percentage of sale price.
Advanced Break-Even Applications
Multi-Product Break-Even Analysis
When selling multiple products, use weighted average contribution margin:
Example:
- Product A: 40% of sales, $30 contribution margin
- Product B: 60% of sales, $45 contribution margin
Weighted Average Contribution Margin:
(0.40 × $30) + (0.60 × $45) = $12 + $27 = $39
Use $39 as your contribution margin for break-even calculation.
Break-Even for Price Changes
Calculate the volume impact you can tolerate with a price change:
Formula:
Required Volume = Old Contribution Margin / New Contribution Margin
Example:
- Current: $50 price, $20 variable cost, 500 units = $15,000 contribution
- Proposed: $45 price, $20 variable cost
- Required Volume = $30 / $25 = 1.20x current = 600 units
Decision: Can you maintain 600 units at the lower price? If not, don't drop the price.
Break-Even for New Investment
Evaluating a new fixed cost investment:
Question: Should I hire another salesperson at $5,000/month?
Calculation: How many additional units needed?
Additional Units Needed = $5,000 / $30 contribution = 167 units/month
Decision: Can this salesperson generate 167+ units/month? If yes, hire. If no, don't.
Target Profit Break-Even
Calculate sales needed to hit a profit target:
Units Needed = (Fixed Costs + Target Profit) / Contribution Margin
Example:
- Fixed costs: $12,000
- Target profit: $8,000
- Contribution margin: $30
- Units needed = ($12,000 + $8,000) / $30 = 667 units
Break-Even Analysis for Specific Scenarios
Launching a New Product
Before Launch, Calculate:
- Expected fixed costs (development, marketing, overhead allocation)
- Variable cost per unit
- Realistic pricing based on market research
- Break-even volume
- Time to reach that volume
Example Decision Framework:
- Break-even: 1,000 units
- Market size: 50,000 potential customers
- If you can capture 2%+ market share → Launch
- If you need 20%+ market share → Reconsider
Evaluating Price Changes
Before Changing Prices:
- Calculate current break-even
- Calculate new break-even with new price
- Estimate volume impact of price change
- Model profit at new price and volume
Example:
- Current: $50 price, 500 units, $30 margin = $15,000 contribution
- Option A: $45 price, 600 units, $25 margin = $15,000 contribution (break-even on change)
- Option B: $55 price, 450 units, $35 margin = $15,750 contribution (increase profit)
Evaluating Marketing Campaigns
Framework:
- Calculate contribution margin per unit
- Divide by contribution margin to get units needed
- Calculate required conversion rate
Example:
- Campaign cost: $5,000
- Contribution margin: $30/unit
- Units needed: 167 units
- Expected traffic: 10,000 visitors
- Required conversion: 1.67%
Decision: If baseline conversion is 2%+, run the campaign. If baseline is 1%, don't.
Tools and Resources
Break-Even Calculators
Our Recommendation: WMMW Break-Even Calculator
- Simple interface
- Unit and revenue calculations
- Margin of safety
- Profit projections
- Scenario modeling
Related Calculators
- ROI Calculator - Calculate return on investments
- Customer LTV Calculator - Understand customer value
- Conversion Rate Calculator - Optimize conversion to reach break-even faster
- Marketing ROI Calculator - Track campaign effectiveness
Accounting Software Integration
Most accounting software can help track break-even:
- QuickBooks: Profit & Loss reports
- Xero: Real-time cost tracking
- FreshBooks: Expense categorization
- Wave: Free option for small businesses
Conclusion
Break-even analysis is fundamental to business success. It gives you clarity on:
- How many sales you need to stay afloat
- Whether your business model is viable
- What happens if costs change or sales fluctuate
- Where to focus cost reduction efforts
- When you'll reach profitability
Key Takeaways:
- Know your numbers: Track fixed costs, variable costs, and contribution margin religiously
- Calculate regularly: Update break-even analysis quarterly or when costs change
- Build in safety: Aim for 30%+ margin of safety
- Optimize continuously: Always look for ways to reduce break-even point
- Use it for decisions: Evaluate every major decision through break-even lens
Ready to find your break-even point?
Calculate Your Break-Even Point →
It takes 2 minutes and could be the most important financial calculation you make this year.
Related Resources:
- ROI Calculator - Calculate investment returns
- Conversion Rate Calculator - Optimize sales to reach break-even faster
- Marketing ROI Calculator - Track marketing effectiveness
- Payback Period Calculator - Calculate time to recover investments
Questions? Contact our financial analysis team.
Share this insight
Help your network discover smarter analytics.