Customer Acquisition Cost (CAC): The Complete Guide for 2026
Everything you need to know about calculating, tracking, and optimizing CAC. Includes benchmarks, LTV:CAC ratios, and strategies to reduce acquisition costs.
Customer Acquisition Cost (CAC): The Complete Guide for 2026
Customer Acquisition Cost (CAC) is the single most important metric for understanding the efficiency of your growth engine. Get it wrong, and you'll either overspend on unprofitable customers or underspend and miss growth opportunities.
This comprehensive guide covers everything from basic CAC calculation to advanced optimization strategies used by the fastest-growing companies.
What is Customer Acquisition Cost (CAC)?
CAC is the total cost of acquiring a new customer, including all sales and marketing expenses divided by the number of customers acquired in that period.
Why CAC is Critical
For Growth:
- Determines how much you can afford to spend on acquisition
- Identifies which channels are most efficient
- Guides budget allocation decisions
- Measures marketing effectiveness
For Profitability:
- Ensures acquisition costs don't exceed customer value
- Highlights unsustainable growth patterns
- Helps optimize pricing strategy
- Reveals unit economics health
For Fundraising:
- Key metric investors scrutinize
- Demonstrates scalability potential
- Proves business model viability
- Justifies growth investment
The Fundamental Formula
CAC = Total Sales & Marketing Costs / Number of New Customers
Simple in concept, but the devil is in the details.
How to Calculate CAC (The Right Way)
Step 1: Define Your Time Period
Choose a consistent period:
- Monthly: For fast-moving businesses, high volume
- Quarterly: Standard for most businesses
- Annually: For long sales cycles, B2B
Important: Match your CAC period to your customer behavior. If customers take 3 months to convert, use quarterly or longer.
Step 2: Sum All Sales & Marketing Costs
Marketing Costs:
- Paid advertising (Facebook, Google, TikTok, etc.)
- Content marketing production
- SEO and website costs
- Marketing technology (tools, software)
- Events and sponsorships
- Agency and contractor fees
- Creative production costs
Sales Costs:
- Sales team salaries and commissions
- Sales operations staff
- Sales software and tools (CRM, dialers, etc.)
- Sales training and travel
- Demo and trial costs
Overhead Allocation:
- Portion of office space for sales/marketing
- Utilities and administrative support
- Management time allocated to these functions
Step 3: Count New Customers
Be Precise About "New":
- Only count customers acquired in the period
- Exclude existing customers who upgraded
- Don't count trials that haven't converted yet
- Separate new vs. expansion revenue
For Subscription Businesses: Count customers who started paying subscriptions, not just signed up for trials.
For E-commerce: Count first-time purchasers, not repeat purchases.
Step 4: Calculate CAC
Example (E-commerce):
March 2026 Costs:
- Facebook ads: $25,000
- Google ads: $15,000
- Influencer marketing: $5,000
- Marketing tools: $2,000
- Marketing team salaries: $12,000
- Content creation: $3,000
- Total: $62,000
New Customers in March: 1,240
CAC: $62,000 / 1,240 = $50 per customer
Use our calculator: CAC Calculator →
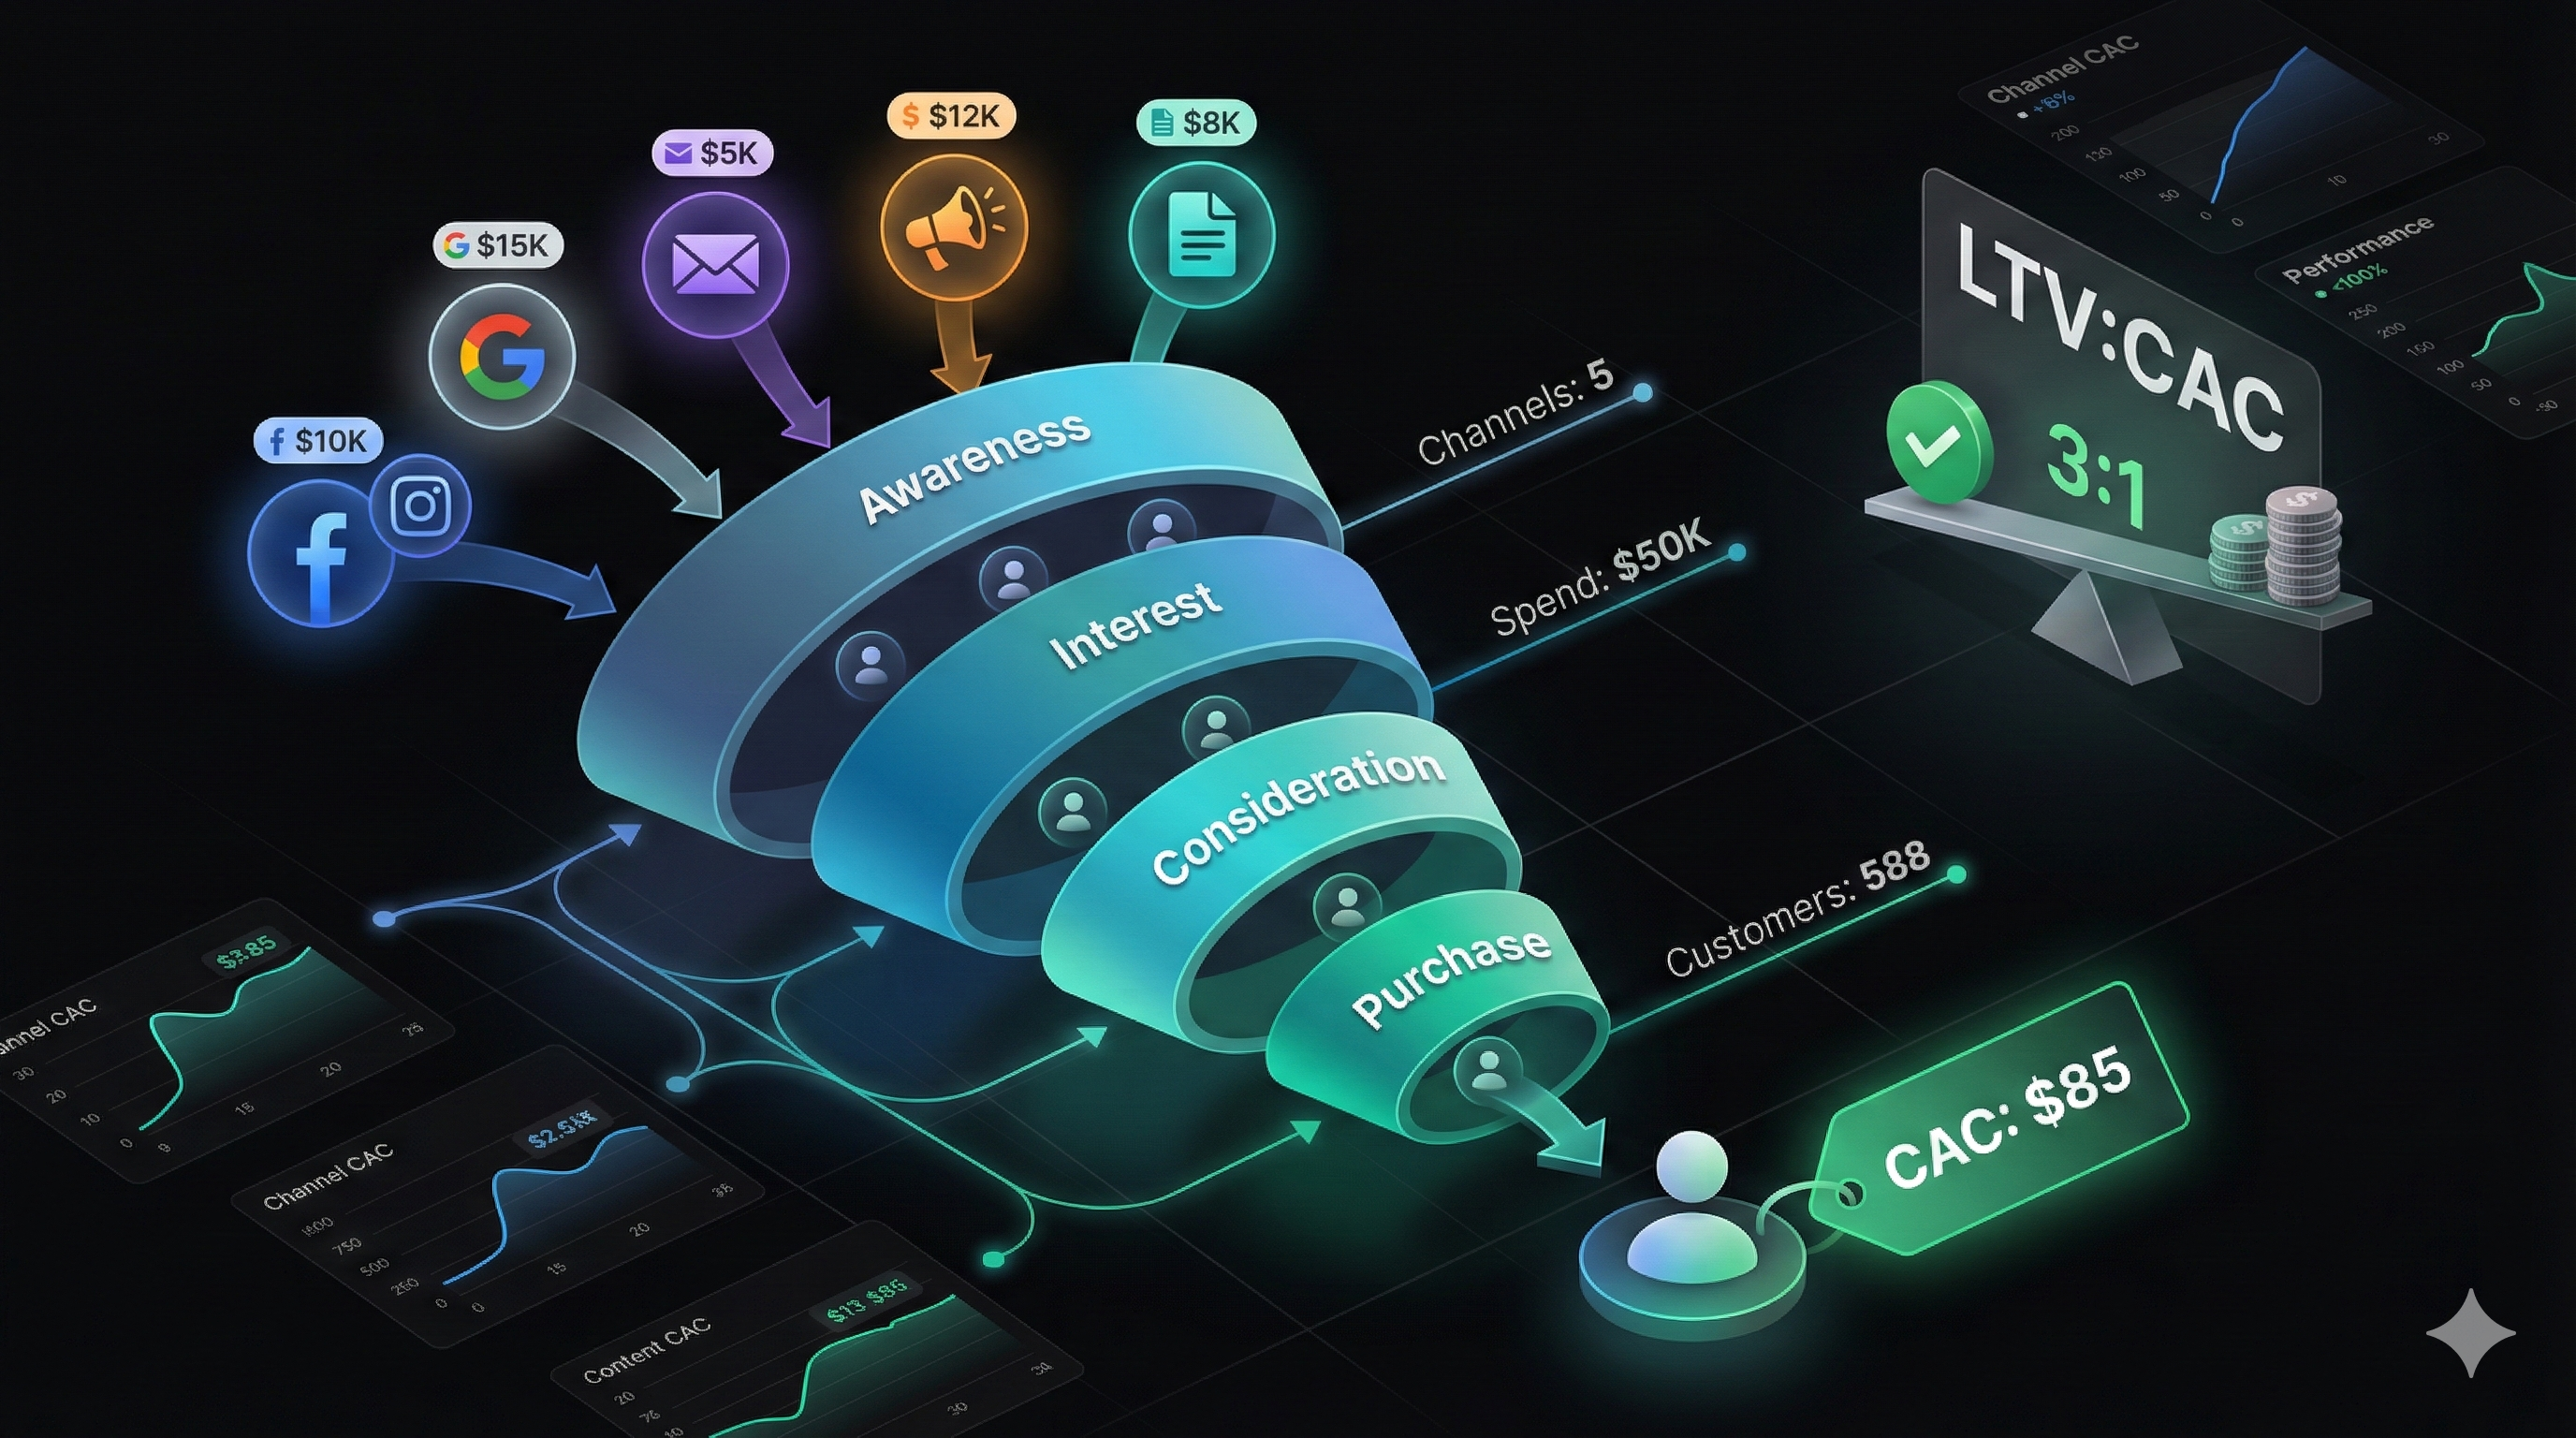
CAC by Channel (Multi-Channel Tracking)
Blended CAC is useful, but channel-specific CAC reveals where to allocate budget.
Calculating Channel-Specific CAC
Formula:
Channel CAC = Channel Costs / Customers from Channel
Example Breakdown:
| Channel | Spend | Customers | CAC |
|---|---|---|---|
| Facebook Ads | $25,000 | 420 | $59.52 |
| Google Ads | $15,000 | 380 | $39.47 |
| Influencer | $5,000 | 95 | $52.63 |
| SEO/Organic | $3,000 | 245 | $12.24 |
| Email Marketing | $2,000 | 100 | $20.00 |
| Blended | $50,000 | 1,240 | $40.32 |
Insights:
- Google has lowest paid CAC ($39.47)
- SEO delivers incredible efficiency ($12.24)
- Influencer marketing is expensive ($52.63)
- Decision: Increase Google and SEO investment, optimize or reduce influencer spend
Attribution Challenge
The Problem: Most customers touch multiple channels before converting.
Example Customer Journey:
- Sees Facebook ad → Doesn't convert
- Searches on Google → Visits site
- Gets retargeted on Facebook → Clicks
- Receives email → Purchases
Which channel gets credit?
Attribution Models for CAC
Last-Touch Attribution (Simplest):
- All credit to final touchpoint
- Email gets 100% credit in example above
- Undervalues awareness channels
First-Touch Attribution:
- All credit to initial touchpoint
- Facebook gets 100% credit
- Undervalues conversion channels
Multi-Touch Attribution (Most Accurate):
- Credit distributed across touchpoints
- Example: Facebook 40%, Google 30%, Email 30%
- Requires sophisticated tracking
Recommendation: Start with last-touch for simplicity, evolve to multi-touch as you scale.
CAC Benchmarks by Industry
Based on 2025-2026 data across thousands of companies:
E-commerce/DTC
| Category | Average CAC | Excellent | Poor |
|---|---|---|---|
| Fashion | $45 | < $35 | > $65 |
| Beauty/Cosmetics | $55 | < $40 | > $75 |
| Home Goods | $60 | < $45 | > $85 |
| Fitness/Wellness | $50 | < $38 | > $70 |
| Food & Beverage | $42 | < $30 | > $60 |
Note: CAC should be 30-40% of first-purchase AOV for healthy unit economics.
SaaS
| Company Type | Average CAC | Excellent | Poor |
|---|---|---|---|
| B2B SMB SaaS | $350 | < $250 | > $500 |
| B2B Mid-Market | $2,500 | < $1,800 | > $3,500 |
| B2B Enterprise | $15,000 | < $10,000 | > $25,000 |
| B2C SaaS | $150 | < $100 | > $250 |
Note: CAC should be recovered in 12 months or less for healthy SaaS companies.
B2B Services
| Service Type | Average CAC | Excellent | Poor |
|---|---|---|---|
| Agency/Consulting | $1,200 | < $800 | > $2,000 |
| Professional Services | $2,500 | < $1,500 | > $4,000 |
| B2B Marketplace | $180 | < $120 | > $280 |
Mobile Apps
| App Category | Average CAC | Excellent | Poor |
|---|---|---|---|
| Gaming | $3.50 | < $2.50 | > $5.00 |
| Utility | $2.80 | < $2.00 | > $4.00 |
| Subscription | $8.50 | < $6.00 | > $12.00 |
| E-commerce | $5.20 | < $3.80 | > $7.50 |
Subscription Boxes
| Category | Average CAC | Excellent | Poor |
|---|---|---|---|
| Food/Meal Kits | $85 | < $65 | > $120 |
| Beauty | $65 | < $50 | > $90 |
| Pet | $70 | < $55 | > $95 |
Important: These are averages. Your CAC depends on business model, pricing, margins, and LTV.
LTV:CAC Ratio Explained
The LTV:CAC ratio is the most important metric for understanding unit economics health.
The Formula
LTV:CAC Ratio = Customer Lifetime Value / Customer Acquisition Cost
Interpreting LTV:CAC
| Ratio | Assessment | What It Means | Action |
|---|---|---|---|
| < 1:1 | Critical | Losing money on every customer | Fix immediately or shut down |
| 1:1 to 2:1 | Poor | Not sustainable | Reduce CAC or increase LTV |
| 2:1 to 3:1 | Okay | Breaking even after costs | Room for improvement |
| 3:1 to 4:1 | Good | Healthy business | Optimize and scale |
| 4:1 to 5:1 | Excellent | Strong unit economics | Scale aggressively |
| > 5:1 | Exceptional | Underinvesting? | Consider increasing CAC to grow faster |
The Sweet Spot: 3:1 to 4:1
Why 3:1 is the Minimum:
- CAC recovery + overhead + profit margin
- Buffer for uncertainty
- Room for LTV degradation
- Allows for growth investment
Why > 5:1 Might Be a Problem:
- Suggests you're underinvesting in growth
- Competitors might be capturing market share
- You could afford higher CAC to scale faster
- Opportunity cost of not growing
Example Calculation
SaaS Company:
-
Monthly subscription: $100
-
Average customer lifetime: 24 months
-
Gross margin: 80%
-
LTV: $100 × 24 × 0.80 = $1,920
-
CAC: $480
-
LTV:CAC Ratio: $1,920 / $480 = 4:1 ✅
Interpretation: Excellent ratio. Every dollar spent on acquisition returns $4 in profit. Company should scale acquisition spending.
Blended CAC vs. Channel-Specific CAC
Blended CAC
Definition: Total marketing and sales costs divided by total new customers.
Pros:
- Simple to calculate
- Good for high-level monitoring
- Easy to communicate to stakeholders
Cons:
- Hides channel performance
- Can't optimize effectively
- Mixes efficient and inefficient channels
Use Case: Board reporting, quarterly reviews, overall health check.
Channel-Specific CAC
Definition: Costs and customers attributed to each individual channel.
Pros:
- Reveals which channels are efficient
- Enables smart budget allocation
- Identifies optimization opportunities
- Guides scaling decisions
Cons:
- More complex to calculate
- Requires good attribution
- Takes more time to maintain
Use Case: Weekly optimization, budget planning, growth strategy.
When to Use Each
Use Blended CAC:
- High-level reporting
- Year-over-year comparisons
- Investor presentations
- Setting overall targets
Use Channel-Specific CAC:
- Budget allocation
- Channel optimization
- Scaling decisions
- Marketing team performance
Best Practice: Track both. Report blended for simplicity, optimize using channel-specific.
What Costs to Include in CAC
Always Include
Paid Advertising:
- All ad platform spend
- Paid social (Facebook, Instagram, TikTok, etc.)
- Paid search (Google, Bing)
- Display and programmatic
- Affiliate commissions
Marketing Team:
- Full-time salaries and benefits
- Contractor and agency fees
- Freelancer costs
- Marketing manager/director/VP
Marketing Tools:
- Marketing automation (HubSpot, Marketo)
- Email service providers
- Analytics tools
- A/B testing platforms
- CRM systems (marketing portion)
Sales Team (if you have one):
- Sales rep salaries and commissions
- Sales manager/director compensation
- Sales operations staff
- Sales engineers/solutions architects
Sales Tools:
- CRM (Salesforce, HubSpot)
- Sales engagement platforms
- Video call software
- Proposal software
Creative Production:
- Ad creative design
- Video production
- Copywriting
- Photography
Consider Including
Content Marketing:
- Content writer salaries
- SEO tools and consultants
- Blog production costs
Why Optional: Content often drives long-term organic traffic. You might track separately or amortize over longer period.
Events and Conferences:
- Booth costs
- Travel expenses
- Sponsorships
Why Optional: Often serves multiple purposes (awareness, sales, partnerships).
Public Relations:
- PR agency retainers
- Press release distribution
Why Optional: Usually focused on brand building, not direct acquisition.
Never Include
Product Development: Building the product customers buy Customer Support: Post-purchase support costs Server/Hosting: Infrastructure costs General Admin: HR, finance, legal COGS: Cost of goods sold
These belong in other metrics (gross margin, operating expenses), not CAC.
CAC Payback Period
CAC payback period measures how long it takes to recover acquisition costs from a customer.
The Formula
CAC Payback Period (months) = CAC / (MRR × Gross Margin)
Where:
- MRR = Monthly Recurring Revenue per customer
- Gross Margin = Revenue minus direct costs (%)
Example
SaaS Company:
- CAC: $480
- Monthly subscription (MRR): $100
- Gross margin: 80%
- Payback Period: $480 / ($100 × 0.80) = 6 months
Interpretation: Takes 6 months to recover acquisition cost. Excellent for SaaS.
Payback Period Benchmarks
| Industry | Excellent | Good | Acceptable | Poor |
|---|---|---|---|---|
| SaaS (B2B) | < 6 months | 6-12 months | 12-18 months | > 18 months |
| SaaS (B2C) | < 3 months | 3-6 months | 6-9 months | > 9 months |
| E-commerce | < 1 month | 1-2 months | 2-4 months | > 4 months |
| Subscription Box | < 2 months | 2-4 months | 4-6 months | > 6 months |
Why It Matters:
- Shorter payback = faster cash cycle
- Less capital required to grow
- Lower risk
- Can scale faster
Rule of Thumb: Aim to recover CAC within 12 months.
Organic vs. Paid CAC
Organic Acquisition Costs
What Counts as Organic:
- Direct traffic (existing brand awareness)
- Organic search (SEO)
- Organic social media
- Word-of-mouth and referrals
- Email (from earned list)
Calculating Organic CAC:
Organic CAC = Organic Channel Costs / Organic Customers
Costs Include:
- Content team salaries
- SEO tools and consultants
- Community management
- Social media management
- Technical website costs
Example:
- Content team: $10,000/month
- SEO tools: $500/month
- Social media manager: $4,000/month
- Organic customers: 350
- Organic CAC: $14,500 / 350 = $41.43
Key Insight: Organic CAC is rarely zero. It costs money to build channels that generate "free" traffic.
Paid Acquisition Costs
Paid Channels:
- Paid search
- Paid social
- Display advertising
- Affiliate marketing
- Sponsored content
Calculating Paid CAC:
Paid CAC = Paid Ad Spend + (Sales Team × % Time on Paid Leads) / Paid Customers
Example:
- Paid ad spend: $35,000
- Sales team time on paid leads: $5,000
- Paid customers: 450
- Paid CAC: $40,000 / 450 = $88.89
The Balance
Healthy Mix:
- Growth Stage: 70% paid, 30% organic (scale quickly)
- Mature Stage: 50% paid, 50% organic (sustainable efficiency)
- Market Leader: 30% paid, 70% organic (brand dominance)
Why Organic Matters:
- Lower CAC over time
- More defensible (owned assets)
- Better margins
- Less dependent on ad platforms
Why Paid Matters:
- Predictable and scalable
- Fast results
- Precise targeting
- Easy to measure
10 Proven Strategies to Reduce CAC
Strategy 1: Improve Conversion Rate
Impact: Same traffic, more customers = lower CAC
Tactics:
- A/B test landing pages continuously
- Optimize page speed (1 second = 7% conversion drop)
- Simplify checkout/signup flow
- Add trust signals and social proof
- Improve product copy and images
- Reduce form fields
Expected Impact: 20-40% CAC reduction from 15-20% conversion improvement
Calculate optimization impact: Conversion Rate Calculator →
Strategy 2: Optimize Targeting
Impact: Reach people more likely to convert
Tactics:
- Refine audience targeting (demographics, interests, behaviors)
- Create lookalike audiences from best customers
- Use negative keywords (paid search)
- Exclude poor-performing segments
- Focus on high-intent keywords
Expected Impact: 15-30% CAC reduction
Strategy 3: Improve Creative
Impact: Better ads = higher CTR = lower CPC = lower CAC
Tactics:
- Test 5-10 ad variations weekly
- Use video (3-5x higher engagement)
- Test hooks in first 3 seconds
- Use user-generated content
- Test different ad formats
- Refresh creative monthly
Expected Impact: 20-35% CAC reduction from creative optimization
Strategy 4: Focus on High-Intent Channels
Impact: Target people closer to purchase decision
Tactics:
- Invest more in bottom-funnel (branded search, remarketing)
- Use intent data tools
- Target competitors' keywords
- Focus on review and comparison content
- Leverage buyer keyword signals
Expected Impact: 10-25% CAC reduction
Strategy 5: Increase Customer Lifetime Value
Impact: If LTV goes up, you can afford higher CAC
Tactics:
- Improve retention (biggest lever)
- Implement upsell and cross-sell
- Increase pricing strategically
- Add subscription/repeat purchase model
- Enhance product quality
Example: If LTV increases from $200 to $300, you can afford 50% higher CAC while maintaining same LTV:CAC ratio.
Calculate your LTV: Customer LTV Calculator →
Strategy 6: Build Organic Channels
Impact: Organic traffic has much lower CAC long-term
Tactics:
- Invest in SEO and content marketing
- Build email list aggressively
- Create referral programs
- Develop social media presence organically
- Encourage user-generated content
Expected Impact: 30-50% blended CAC reduction over 12-18 months
Timeline: Takes 6-18 months to see results, but payoff is enormous
Strategy 7: Optimize Bidding and Budget
Impact: Pay less per click/impression
Tactics:
- Use automated bidding strategically
- Set target ROAS or target CPA
- Allocate budget to best-performing times
- Pause underperforming campaigns quickly
- Use dayparting (show ads at optimal times)
Expected Impact: 10-20% CAC reduction
Strategy 8: Improve Post-Click Experience
Impact: Get more value from expensive clicks
Tactics:
- Create dedicated landing pages (not homepage)
- Match ad message to landing page
- Reduce page load time (aim for < 2 seconds)
- Make CTA prominent and clear
- Add live chat for instant engagement
Expected Impact: 15-30% CAC reduction
Strategy 9: Implement Referral Programs
Impact: Customers acquire customers (lowest CAC channel)
Tactics:
- Offer compelling referral incentives (two-sided)
- Make sharing easy (one-click)
- Time referral asks strategically (after satisfaction)
- Gamify referrals
- Thank and reward referrers
Expected Impact: Referral CAC typically 50-75% lower than paid
Example Referral Incentives:
- Give $20, get $20 (e-commerce)
- Give 1 month free, get 1 month free (SaaS)
- Give 20% off, get 20% off
Strategy 10: Negotiate Better Rates
Impact: Same performance, lower costs
Tactics:
- Negotiate agency fees (aim for 10-15% instead of 20%+)
- Request volume discounts from ad platforms
- Use consolidated billing for tool discounts
- Negotiate annual vs. monthly tool pricing
- Hire in-house to reduce agency dependence
Expected Impact: 10-15% CAC reduction
Common CAC Calculation Mistakes
Mistake #1: Not Including Sales Team
Problem: Only counting marketing costs, forgetting sales salaries
Impact: CAC appears artificially low
Fix: Include all sales team costs in CAC calculation
Mistake #2: Wrong Time Period Attribution
Problem: Counting January marketing costs but February customers
Impact: Misaligned CAC, poor decision-making
Fix: Use cohort-based analysis or shift costs to align with customer acquisition
Mistake #3: Ignoring Attribution Window
Problem: Most customers don't convert immediately
Impact: Undercounting customers from each campaign
Fix: Use 30-60 day attribution windows to capture full customer journey
Mistake #4: Forgetting Platform Fees
Problem: Only counting ad spend, not agency fees or platform percentage
Impact: CAC is 10-20% too low
Fix: Include all fees and commissions
Mistake #5: Treating All Customers Equally
Problem: $10 AOV and $1,000 AOV customers counted the same
Impact: Poor budget allocation
Fix: Segment CAC by customer type, product, or value tier
Mistake #6: Not Accounting for Refunds
Problem: Counting customers who refunded in first 30 days
Impact: Inflated customer count, artificially low CAC
Fix: Only count customers after refund window
Mistake #7: Mixing Time Periods
Problem: Annual marketing costs divided by monthly customer count
Impact: CAC off by 12x
Fix: Ensure all numbers use same time period
Conclusion
CAC is more than just a metric—it's a diagnostic tool that reveals the health and scalability of your business.
Key Takeaways:
- Calculate accurately: Include all sales and marketing costs
- Track by channel: Optimize what you measure
- Monitor LTV:CAC: Aim for 3:1 to 4:1 ratio
- Recover quickly: Target < 12 month payback period
- Optimize continuously: Test and improve relentlessly
- Balance paid and organic: Build sustainable growth
- Segment your analysis: Different customers have different CAC
- Don't forget attribution: Most journeys are multi-touch
Ready to calculate your CAC?
Know your numbers. Optimize your growth. Scale profitably.
Related Resources:
- Customer LTV Calculator - Calculate lifetime value
- Payback Period Calculator - Calculate CAC recovery time
- Marketing ROI Calculator - Track campaign effectiveness
- Break-Even Calculator - Understand profitability
Questions? Contact our growth team.
Share this insight
Help your network discover smarter analytics.